NASA GEDI Project (LIDAR)
The Global Ecosystem Dynamics Investigation (GEDI) is a NASA Earth Venture mission that will produce the first high resolution laser ranging observations of the 3D structure of the Earth. These precise measurements of forest canopy height, canopy vertical structure, and surface elevation, will greatly advance the ability of the scientific community to characterize important carbon and water cycling processes, biodiversity, and habitat.
Equipped with a Riegl VUX-1 laser scanner, the Aeroscout B1-100 and B-330 unmanned helicopters can generate airborne point clouds with extremely high density (5,000 points per square meter) and accuracy (< 2 cm RMSE on flat ground) from low-altitude flights that encompass wide scan angles. These measurements provide the rich detail and individual tree structure associated with terrestrial laser scanning, but at scales associated with airborne measurements. The GEDI project has two main goals:
- The high density point cloud of a 1 square kilometer area is used as a calibration area for the „GEDI” project. GEDI (The Global Ecosystem Dynamics Investigation) is a NASA research project with the aim to measure the 3D structure of the earth using a lidar laser system on the International Space Station. This data will be used to get a better understanding about carbon and water cycling processes and biodiversity.
- The high density point cloud offers the opportunity to exactly determine the biomass of the forest. Single trees and their branches can be visualized to such a detail that not only the diameter of the trunk can be measured, but the whole volume and structure of the tree.
| Project status | ongoing |
| Data typ | LIDAR + Orthophoto |
| UAV | Scout B1-100 & Scout B-330 |
| Completed mission #1 | Pfynwald, Switzerland, 2000p/m2, 1km2, 4h flight time (2017) |
| Completed mission #2 | Zofin, Czech, 3500p/m2, 1km2, 6h flight time, leave off condition (2018) |
| Completed mission #3 | Zofin, Czech, 3500p/m2, 1km2, 6h flight time, leave on condition (2018) |
| Completed mission #4 | La Selva, Costa Rica, 3500p/m2, 1.4km2, 8.5h flight time, torpical forest (2019) |
| Completed mission #5 | Lanzhot, Czech, 3500p/m2, 0.4km2, 2h flight time, mixed forest (2019) |
Aeroscout works with researchers from Brown University and the Czech Republic. The project is funded by Brown University.
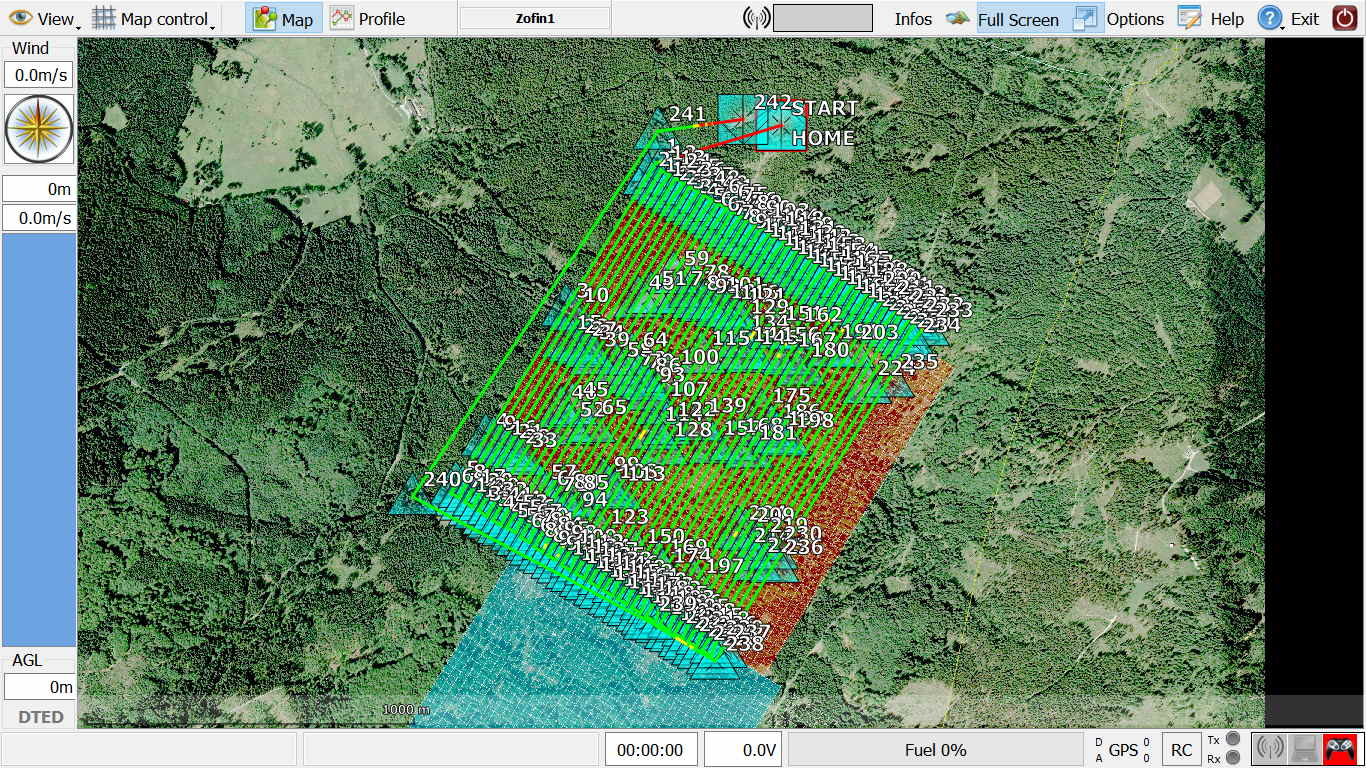
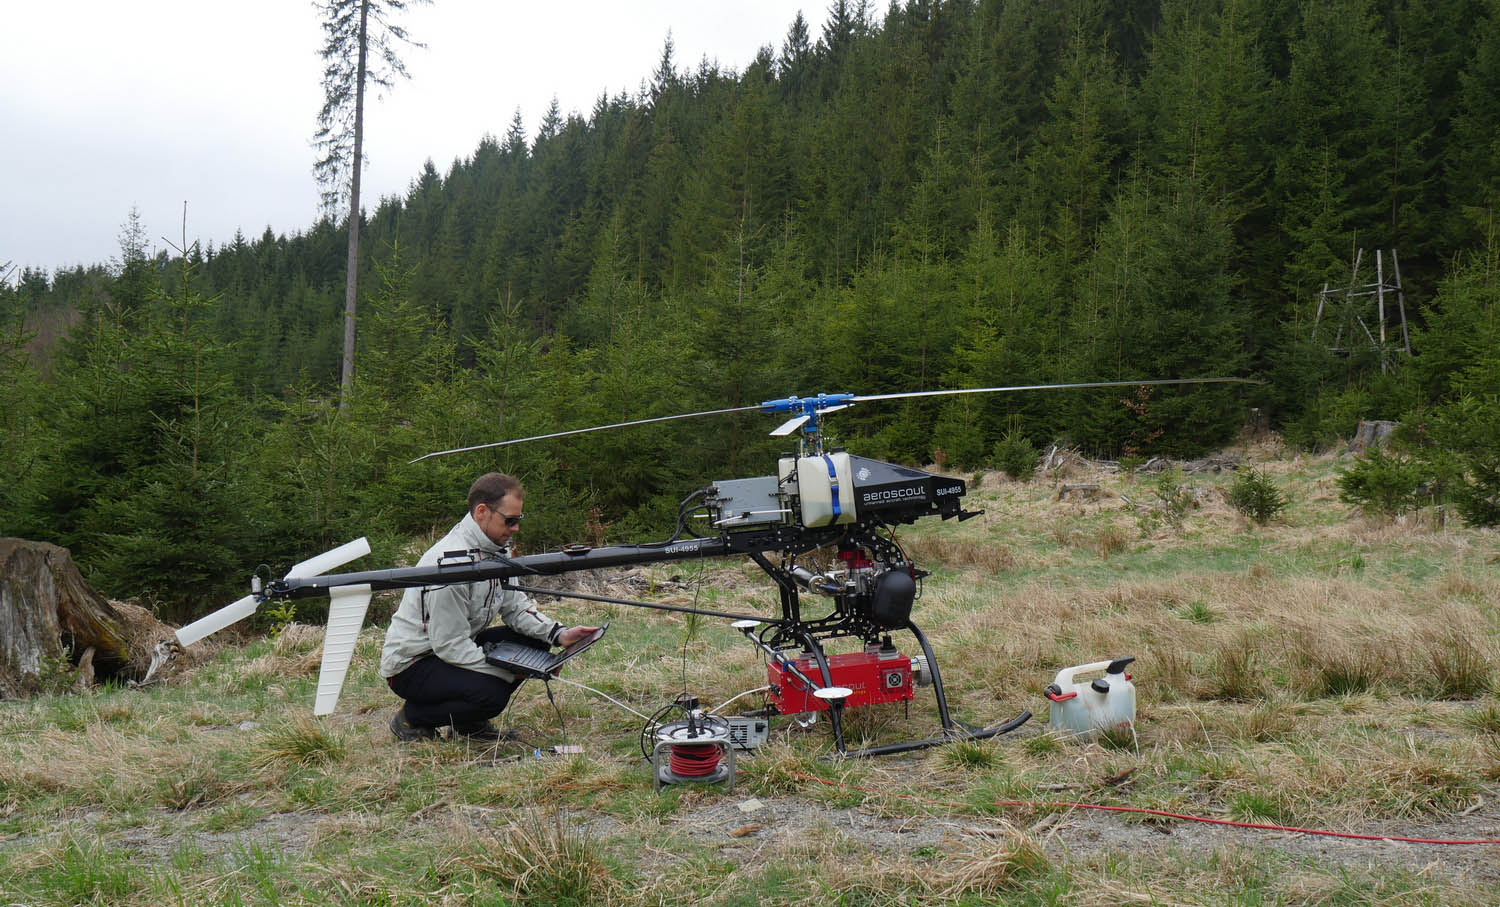
Left picture: The first of several flight plans for the fully autonomous guidence of the UAV Right picture: Downloading the data on the field (approx. 150GB in total)
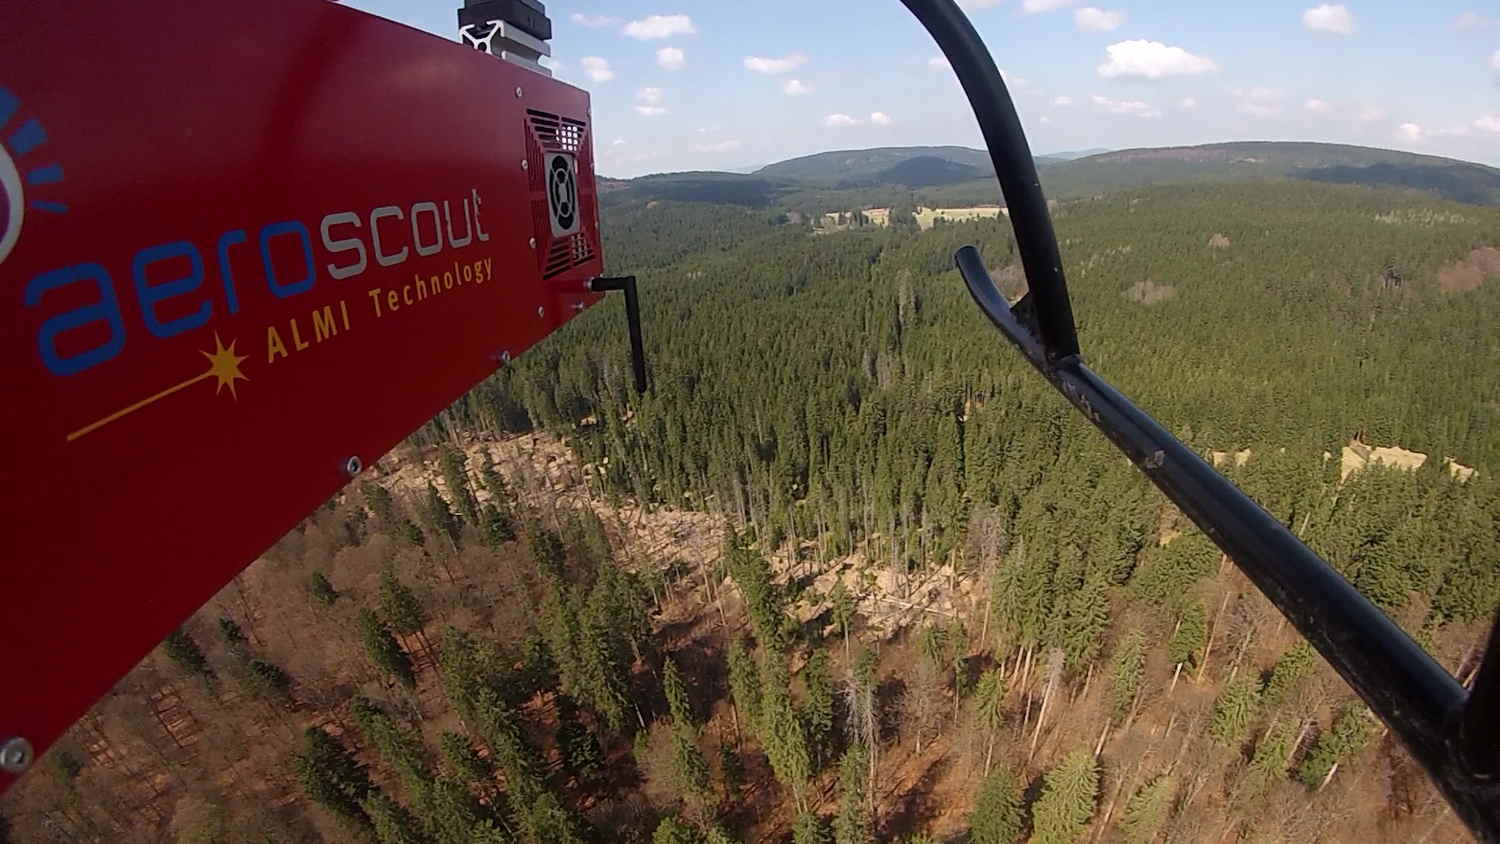
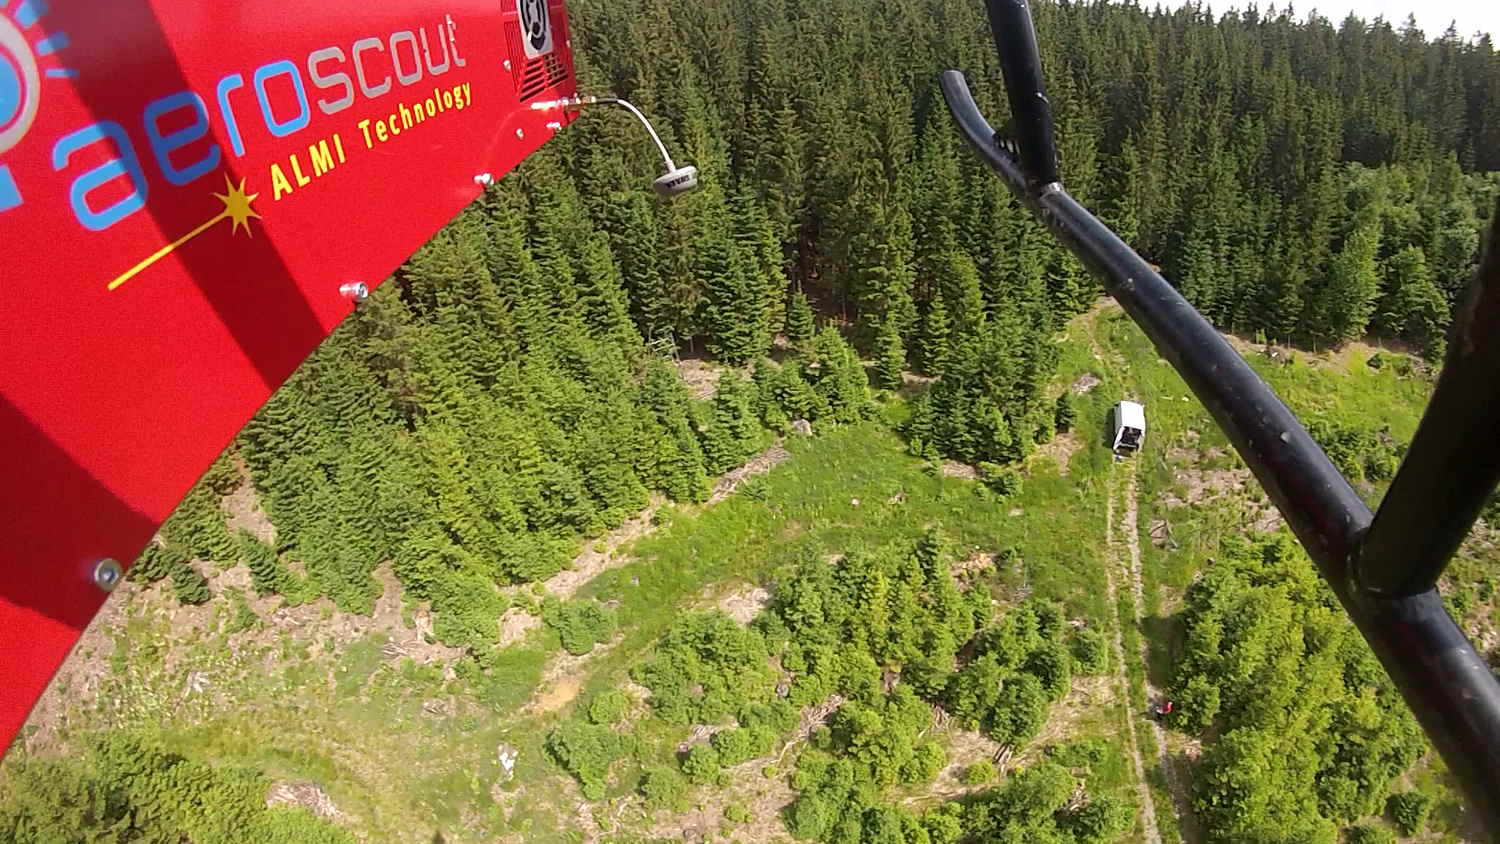
Pictures: In-flight view following the flight path during the mission and before landing close to the ground control station van
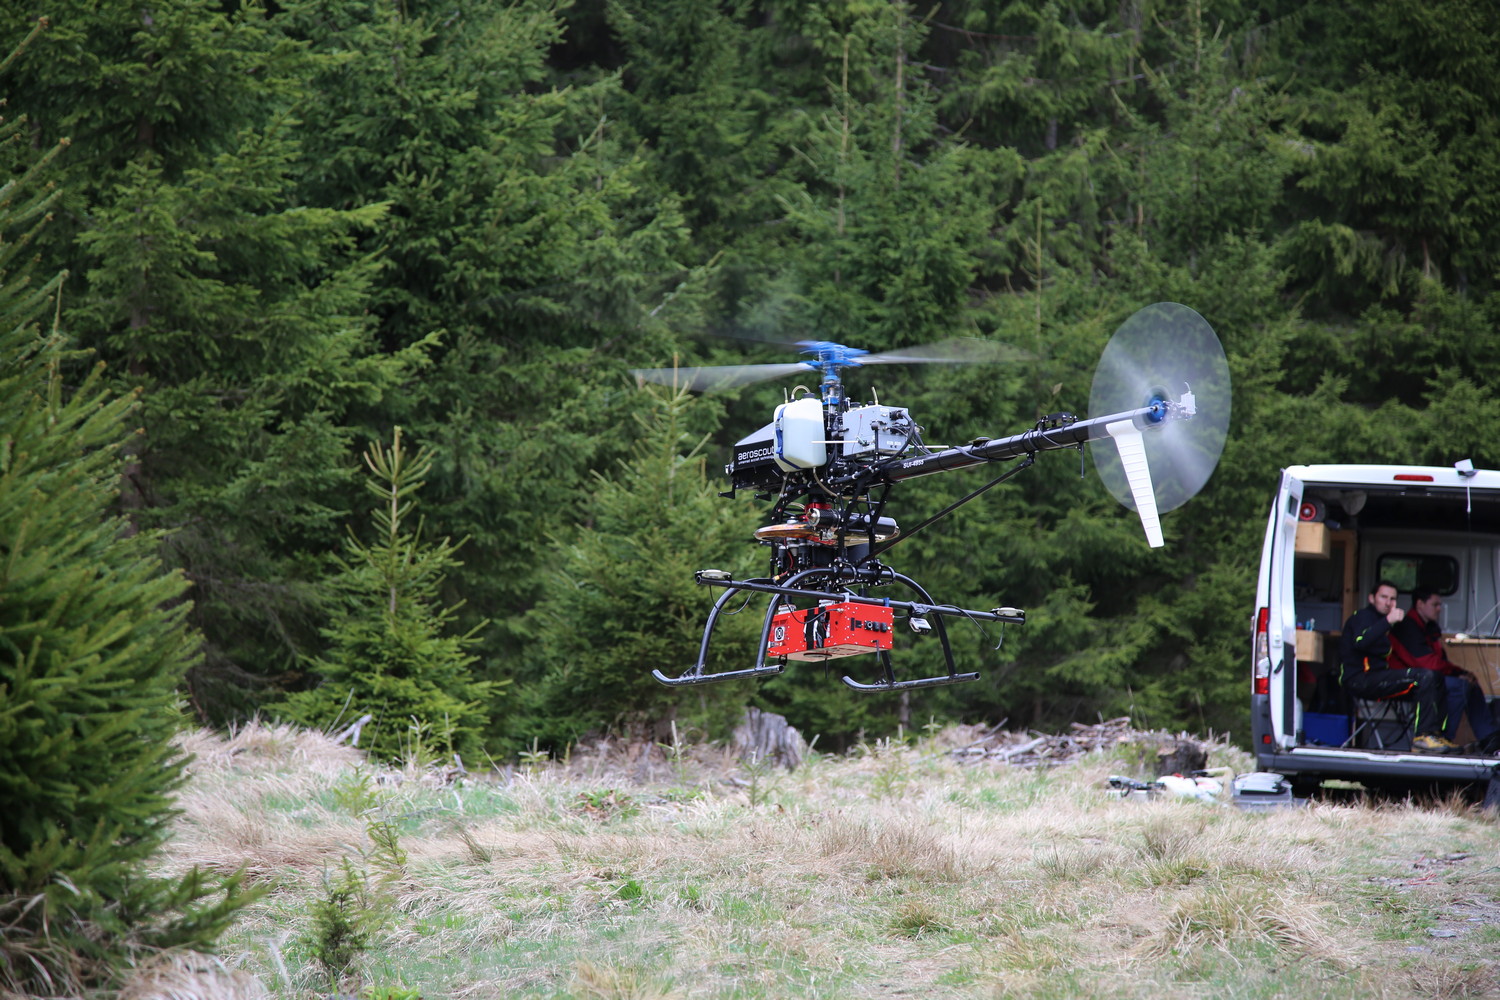
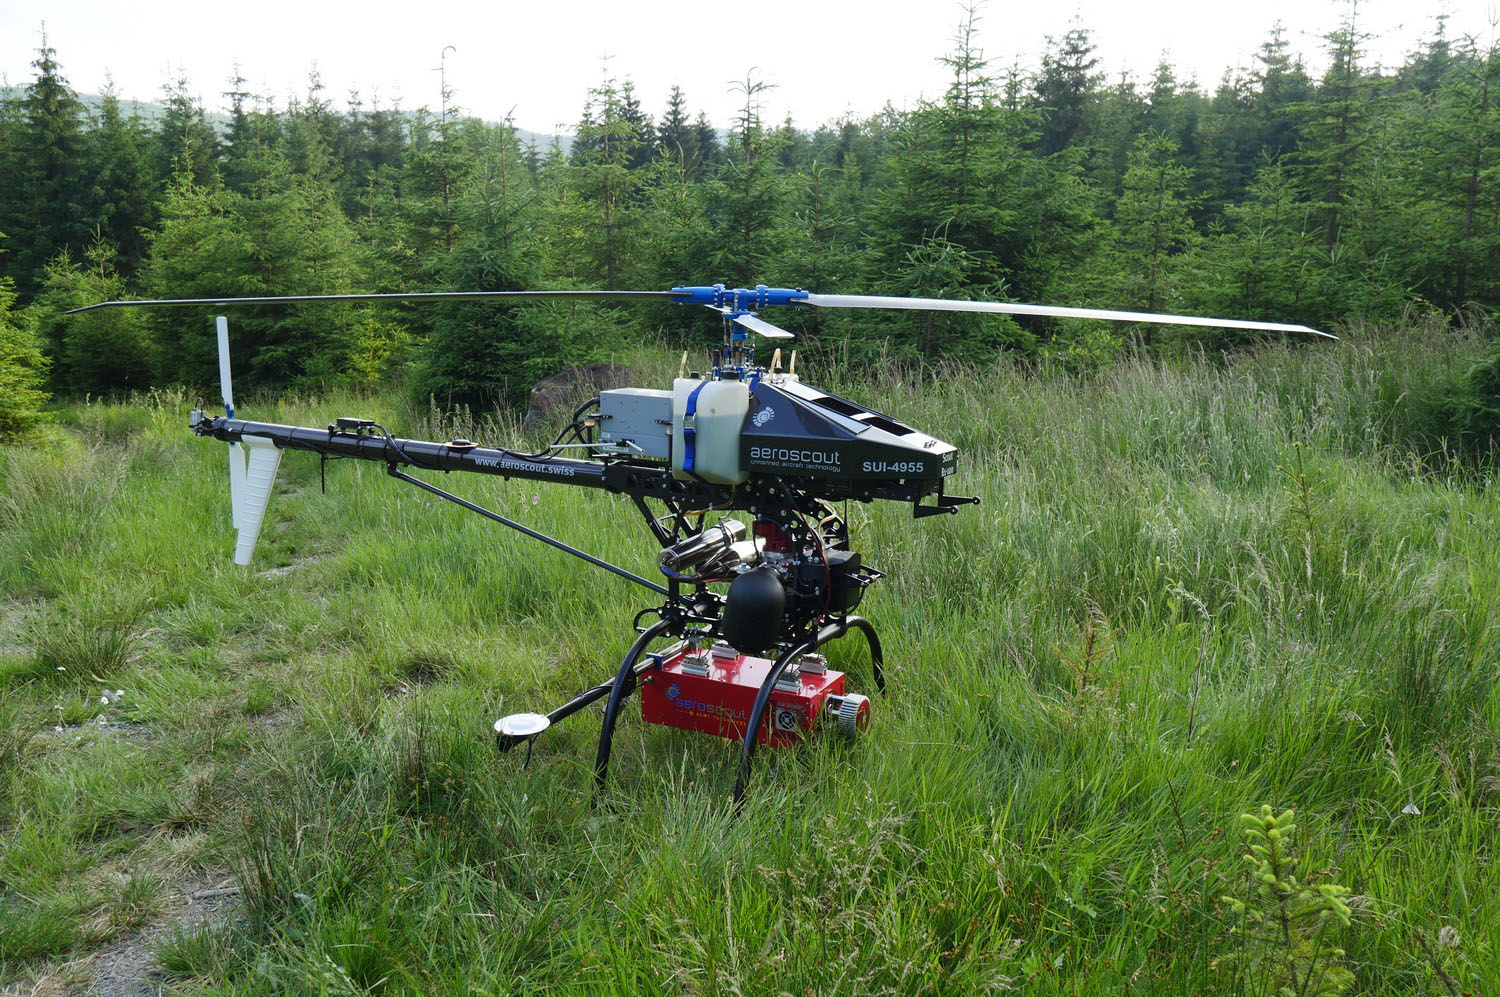
Large-area data collection with Aeroscout helicopters requires 1 – 6 flights (depending on point density requirements) of about 1-hour-and-15-minutes duration, and can be completed in a single day. The total flight path for this laser scan is more than 260km long and requires rigorous vibration and stability control to produce high-quality measurements.
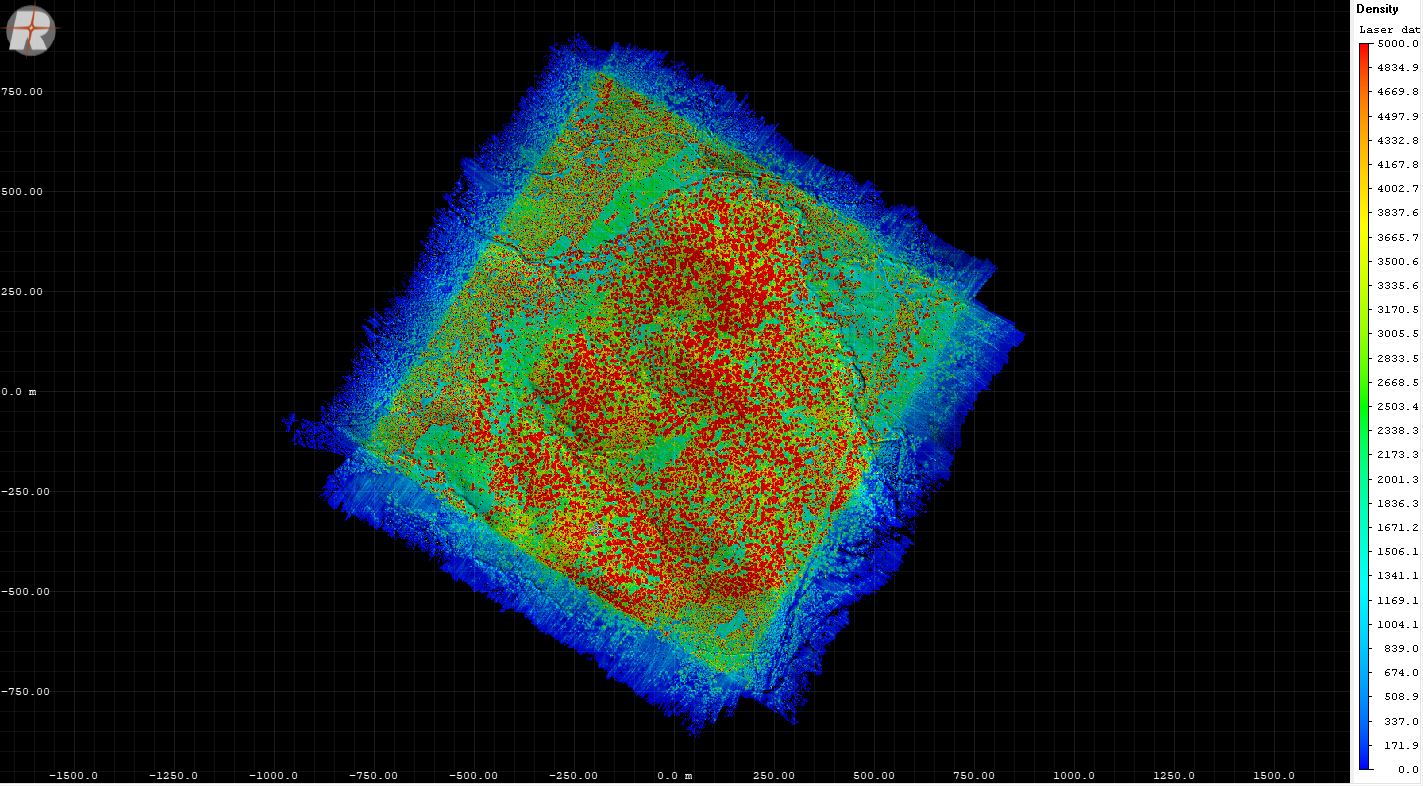
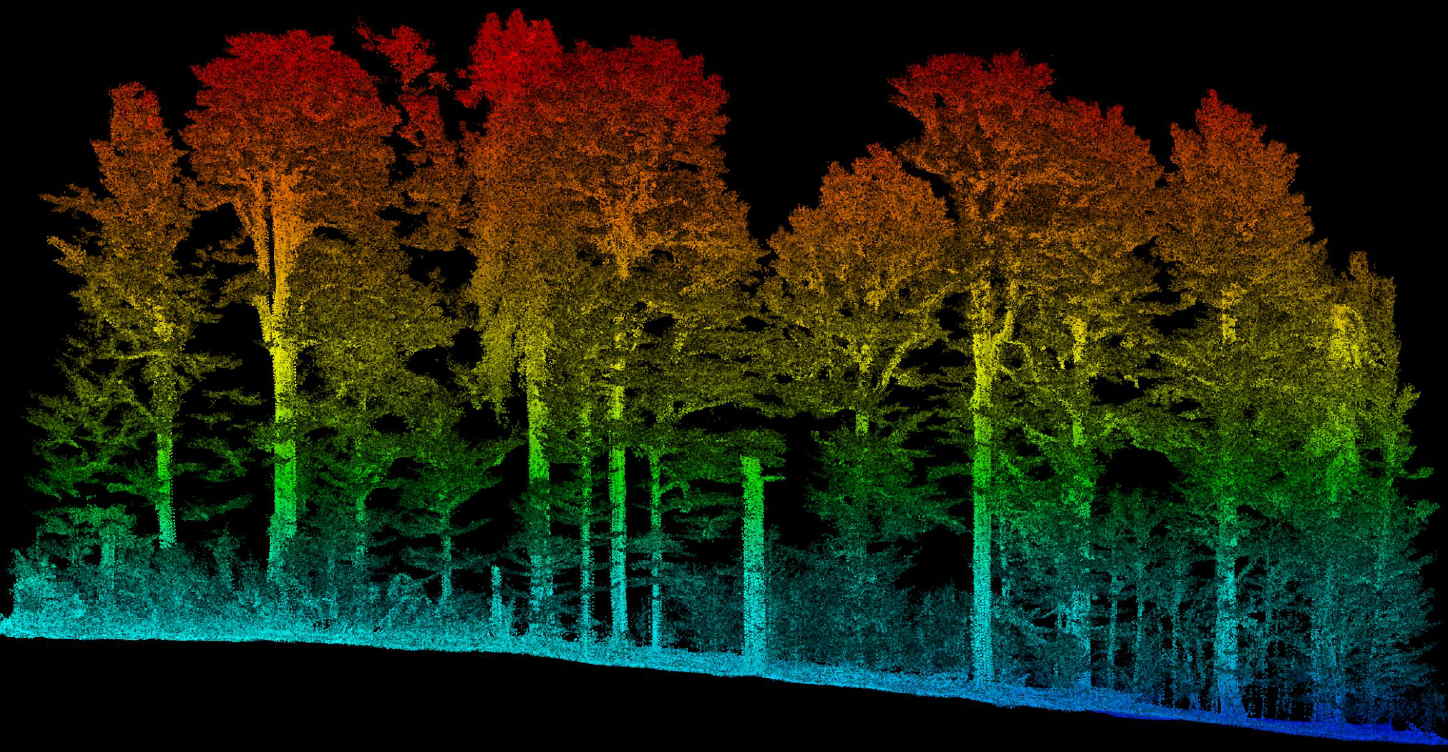
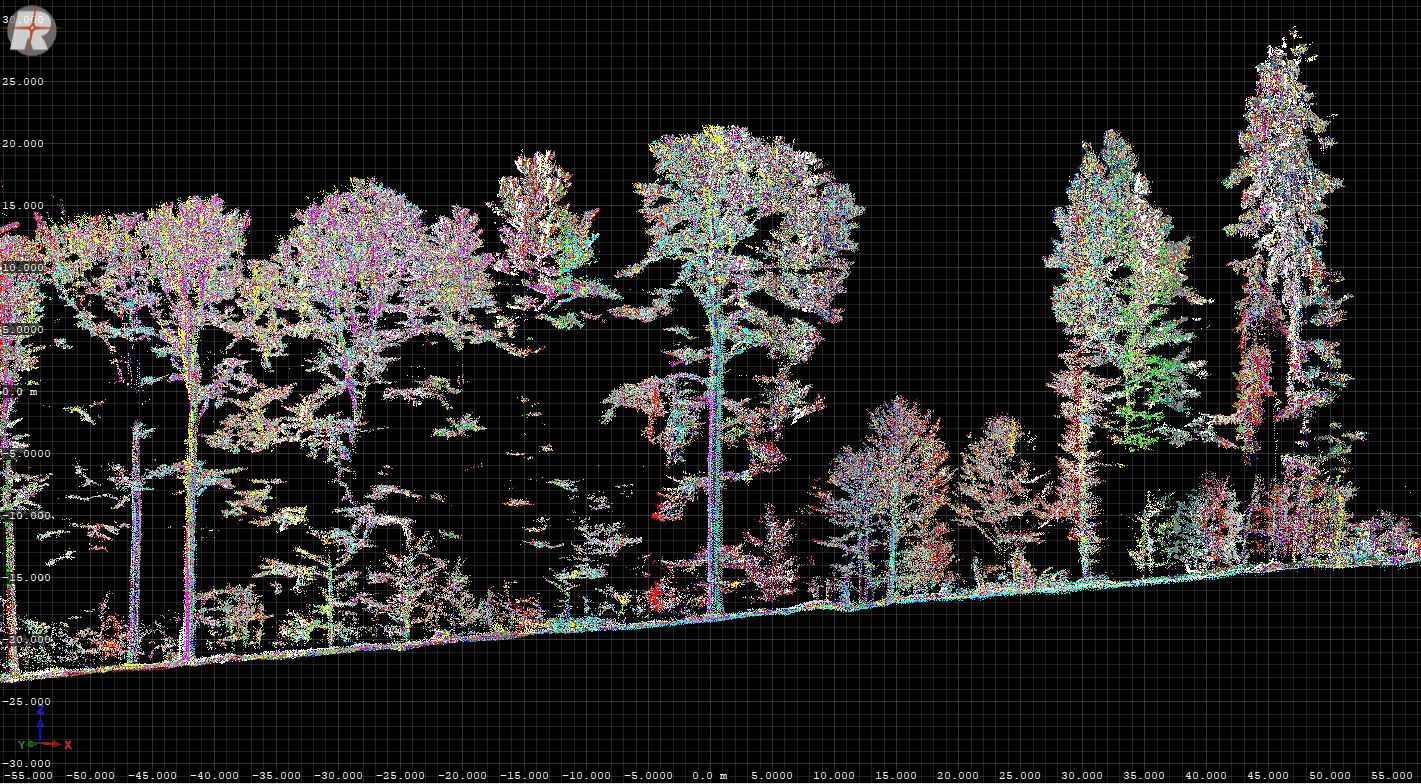
Left picture: Point density of up to 5000 points per square meter (red area) of the whole plot (appox. 1km2) Right Picture: Cross section of trees colorized by altitude
As manned aerial systems usually only have a point density of about 40 to 100 points per square meter because of the flying height and the horizontal speed. UAVs are capable to produce a much higher point density as they can fly at a much lower height over ground and with only a fraction of the speed. The point cloud of a UAV has typically a point density of about 400…600 points per square meter because a lot of the electrically driven drones (e.g. multicopters) only have a flight endurance of 20…30min. In forest areas there is often no takeoff and landing spot, so, a part of the flight endurance has to be spent to fly to the scanning area and return from it.
With a flight endurance of 90 minutes and a payload capacity of 18 kg, the Aeroscout B1-100 was able to meet these objectives. The data were collected in an overall flight time of 7 hours and 72 flight lines.
Post-processing and differential results in accuracy less than 2 cm.
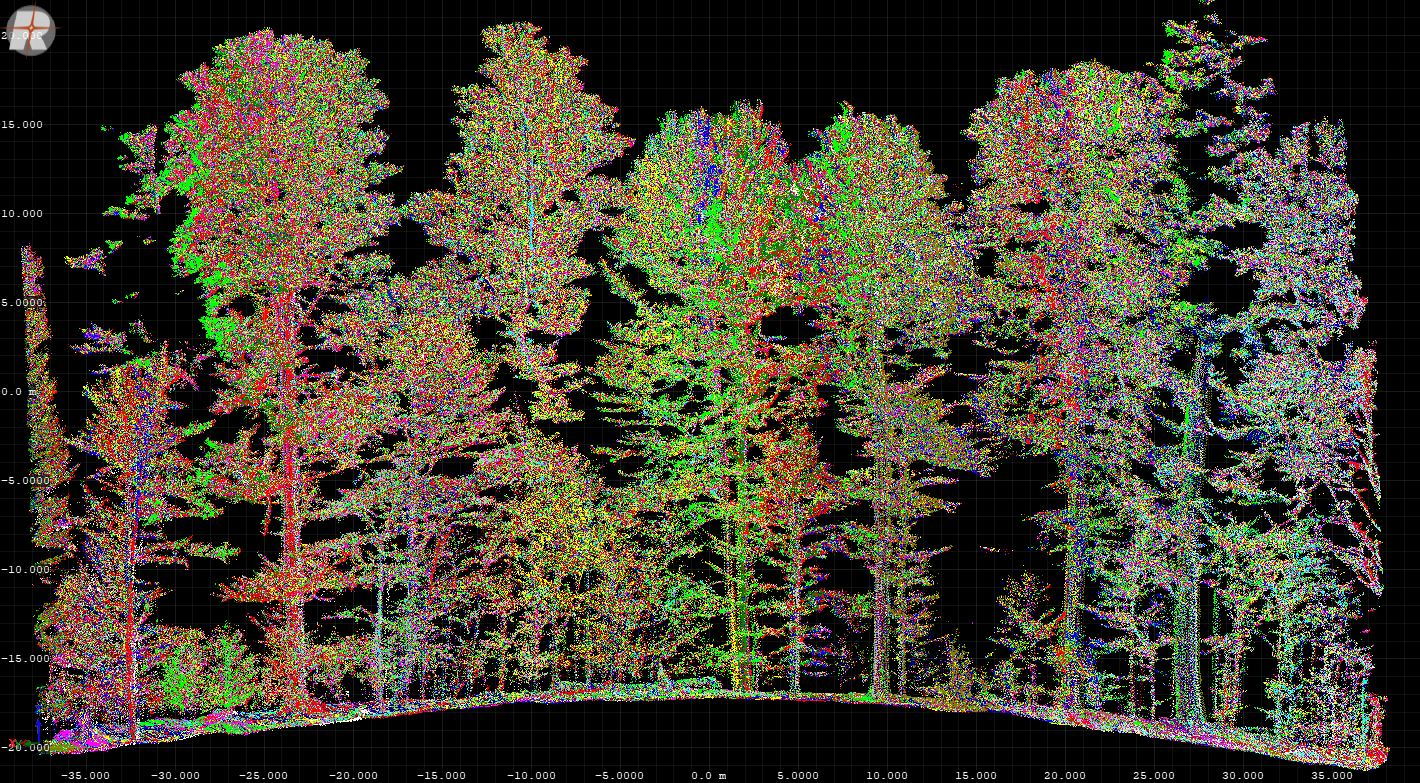
Pictures: The different colors show show the different flight lines. Each tree was scanned from 15-20 different locations of the aircraft
Analyzing the data collected from two dates (April leave off conditions and June leave on conditions) will take several months. This page will publish the links to papers that will discuss the findings in detail. Please contact Aeroscout for further informations.